
Introduction
In April 2022, IP Australia released their 10th edition of the Australian Intellectual Property Report[1] (the Report), and for those with an interest in the number of filings in the various categories of intellectual property (IP) which IP Australia administers, makes for interesting reading.
The Report is aimed at promoting awareness of IP rights and discussing the latest IP statistics. The Report notes a significant up-trend in pharmaceutical patent filings, which is perhaps unsurprising given the need for novel vaccines and treatments during the COVID-19 pandemic. Additionally, there have been significant increases in filings relating to computer and audiovisual technology, which reflects that Australians have adapted to the changes in our social and work environment over this period, and as the economy has moved to a virtual model. Additionally, trade mark and design filings have grown for products that households invest in when upgrading their homes to create comfortable living and workspaces. The Report also “presents evidence that IP activity is a significant forward indicator of employment growth for Australian small and medium enterprises (SMEs)”.[2]
In brief overview, patent applications increased in 2021, recording an 11% growth, with filings from Australian residents up by 25%. Designs, too, are up by 13% (the steepest year-on-year growth this decade), with trade marks recording a 9% increase, driven by a significant increase in resident filings. The number of patent, trade mark and design filings are at record levels. Plant breeder’s rights (PBR) experienced a 6% decrease, likely reflecting the continued impacts of drought, Australia’s devastating bushfires in 2019–2020, COVID-19 lockdowns, and border closures.
Key takeaway points
- Patent filings in 2021 is at a record level. However, over 90% of the applications are from overseas, and provisional application filings continued to decrease.
- Despite COVID-19 restrictions and Australia’s first recession in 30 years, trade mark applications recorded another almost 10% increase in 2021, with a majority of applications coming from Australian residents.
- After filing for IP rights, Australian SMEs are more likely to achieve high growth than their peers, and pay a higher median annual wage, suggesting the importance of filing for IP rights.
Patents
Standard patents
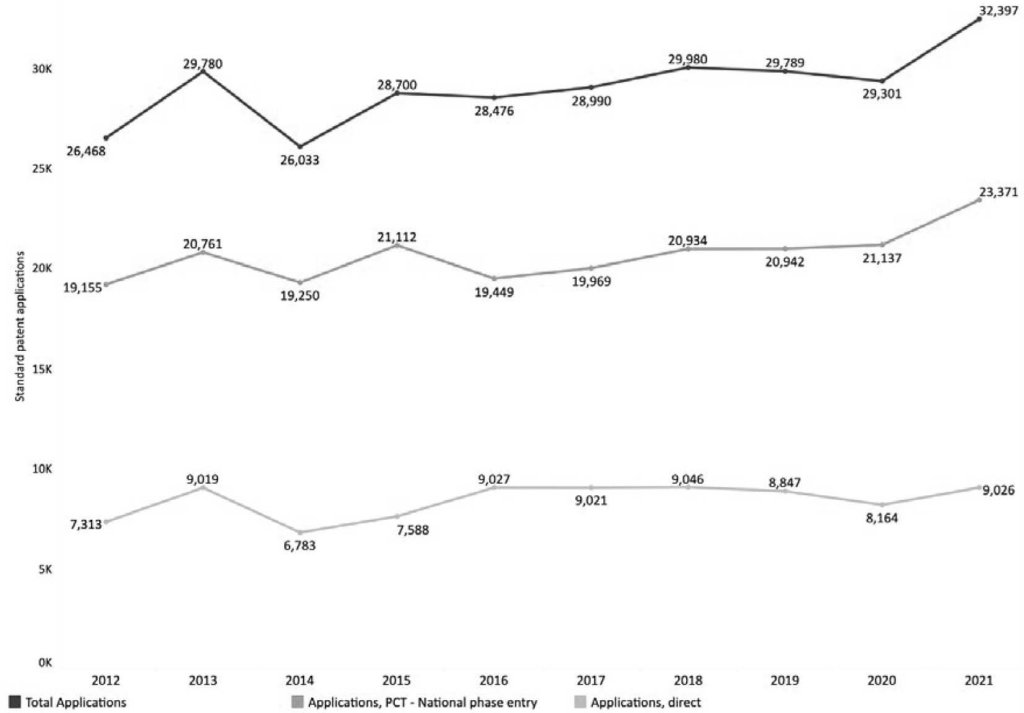
As shown in Figure 1, IP Australia received 32,397 standard patent applications in 2021, which is an increase of 11% from 2020. This increase represents the second largest growth in a decade, which is notable as the large spike in filings in 2012–2013 is likely to be an artefact from the introduction of the Intellectual Property Laws Amendment (Raising the Bar) Act 2012 (Cth) amendments, which encouraged applicants to bring forward national phase entry. The data also confirm that national phase entry from Patent Cooperation Treaty (PCT) applications is the preferred filing route, with 23,371 national phase entries and around 9000 direct entries recorded last year.
Countries of origin
Filings by non-residents increased by 9% and were responsible for just over 90% of applications in 2021 with the United States being the biggest contributor, followed by China, Japan, Germany and the United Kingdom. Notably, the greatest growth was seen in applications from Singapore, Canada and New Zealand, which were up by 62%, 31% and 22% respectively. On the other hand, patent application filings by Australian residents enjoyed a 25% increase in 2021, after a 10% decline in 2020.
Provisional patent applications
Of major concern, however, is the persistent decline in the filing of provisional applications over the past decade. Just over 5400 provisional applications were filed in 2011, which has now dropped by over 20% to 4297 in 2021. The authors of the Report do not speculate on the reasons for the decline, but noting that 94% of provisional applications are filed by Australians or Australian entities, and assuming that the number of provisional applications filed is one indicator of Australian innovation and entrepreneurship, it would seem that fewer and fewer Australian innovations are being developed and protected.
Innovation patents
With the phase-out of the innovation patent system in August 2021, there was a dramatic increase in the demand for innovation patents, with over 7800 applications filed in 2021. This represented a 71% increase from filings in 2020. The majority of the increase was attributed to non-residents who, in 2021, accounted for 78% of filing growth, primarily due to increased filings from China and India.
Overseas applications
A total of 9106 overseas patent applications were filed by Australian inventors in 2020. Most of the applications were filed via the PCT route, which increased from 66% in 2014 to 73% in 2020. The most popular destination for Australian applicants seeking overseas patent protection is the United States, followed by the European Patent Office, China and New Zealand, representing 38%, 11%, 8% and 7%, respectively.
Technology classes
The five leading classes for standard patent applications in 2021 were pharmaceuticals, medical technology, biotechnology, organic fine chemistry and computer technologies. Pharmaceutical patent applications grew by 27% in 2021 after an 18% increase in 2020. Computer technology patent applications increased by 27% to become the fifth-ranked class, possibly driven by the need of remote working and communication due to the current pandemic. In particular, patent filings in AI are growing rapidly, nearly doubling each year. Most of the AI patent filings are from the private sector.
Leading applicants
The top five international patent applicants were LG Electronics, Huawei Technologies, Guangdong Oppo Mobile Telecommunications, Nestlé and Apple, while the top five domestic applicants were Aristocrat Technologies Australia, CSIRO, NewSouth Innovations, ResMed and Breville.
Gender gap in patenting
The Report noted that: “Studies on the gender of inventors on patents show that gender imbalances persist, with substantial differences across countries and technology fields. However, women’s participation in patenting is rising.”[4] Female inventors comprised around 12% of unique Australian inventors listed on patent applications in Australia in 2016, up from 4% in 1980. Over that period, the female inventor share of Australian filings in civil engineering remained low, at just over 10%, but in biotechnology and organic fine chemistry, rose from less than 20% to more than 50%. The Report noted that the increase in participation is primarily due to growth in applications attributed to mixed teams, involving both men and women inventors, and the authors of the Report speculate that the results “could reflect change in the team composition of inventors or, alternatively, shifts in organisational practice with women inventors more likely to be recognised on patent applications for their contributions”.[5]
Trade marks
Trade mark applications and registrations
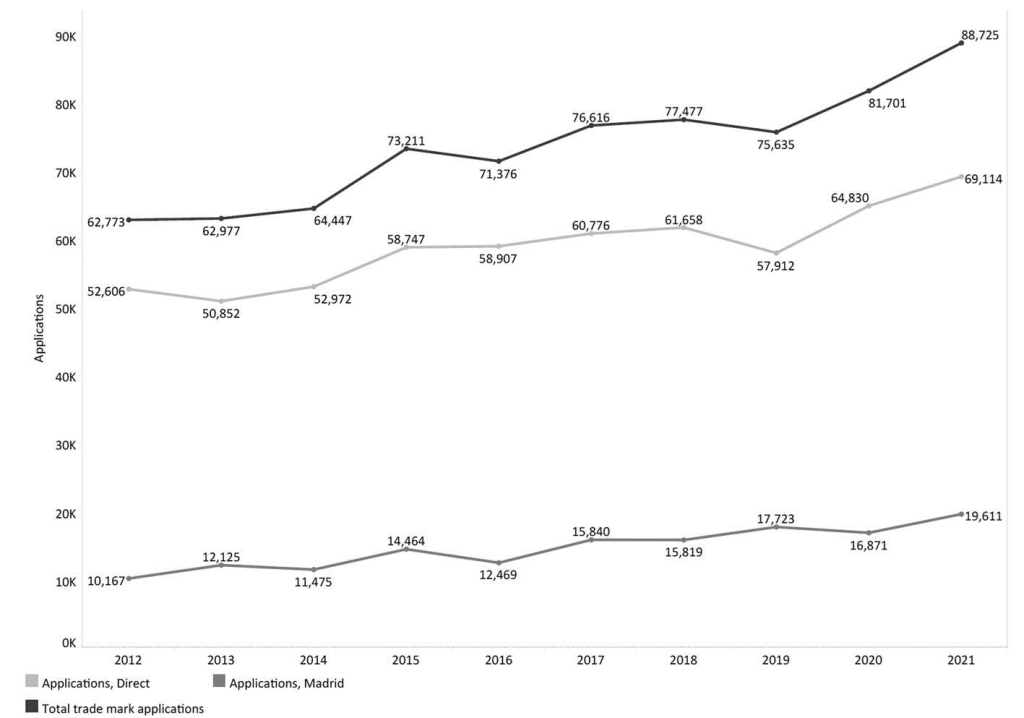
In 2021, as shown in Figure 2, nearly 89,000 trade mark applications were received by IP Australia, which represents a 9% growth from 2020. This growth, together with the 8% increase in 2020, defies Australia’s first recession in 30 years and was regarded as “somewhat unexpected” by the authors of the Report, as “despite ongoing COVID related restrictions, 2021 saw the highest rate of business entry in a decade…and gross disposable income reached its highest level on record”.[6] 78% of the applications in 2021 were direct applications, as opposed to applications through the World Intellectual Property Organization’s Madrid route.
Countries of origin
Despite an 18% increase, non-residents held a lower share of trade mark applications (40%) in 2021 when compared to residents (60%). The leading foreign countries of origin were the United States, China, the United Kingdom, Germany and New Zealand.
Trade mark classes
The 5 classes in the Nice Classification system that received the most applications in 2021 were: Class 9 Technological and electrical apparatus and instruments, Class 35 Advertising, Class 41 Education, training and entertainment, Class 42 Scientific and technological services, and Class 25 Clothing, footwear and headgear. Notably, scientific and technological services applications experienced the largest growth (22%).
Leading applicants
The top five international applicants were Glaxo Group, Apple, Novartis, Samsung Electronics and Philip Morris Products, while the top five domestic applicants were Aristocrat Technologies Australia, Endeavour Group, Coles Group, Aldi Foods and Southcorp Brands.
Overseas applications
A total of 20,425 overseas trade mark applications were filed by Australian applicants in 2020, which was at a similar level with 2019 (with 20,198 applications). Thanks to the expansion of the Madrid system, more than half of the applications were filed via the Madrid route, which increased from 29% in 2012 to 53% in 2021. The most popular destination for Australian applicants seeking overseas trade mark protection is China, followed by the United States, New Zealand and the United Kingdom, representing 19%, 16%, 15% and 7%, respectively.
Designs
Design applications, registrations and certifications
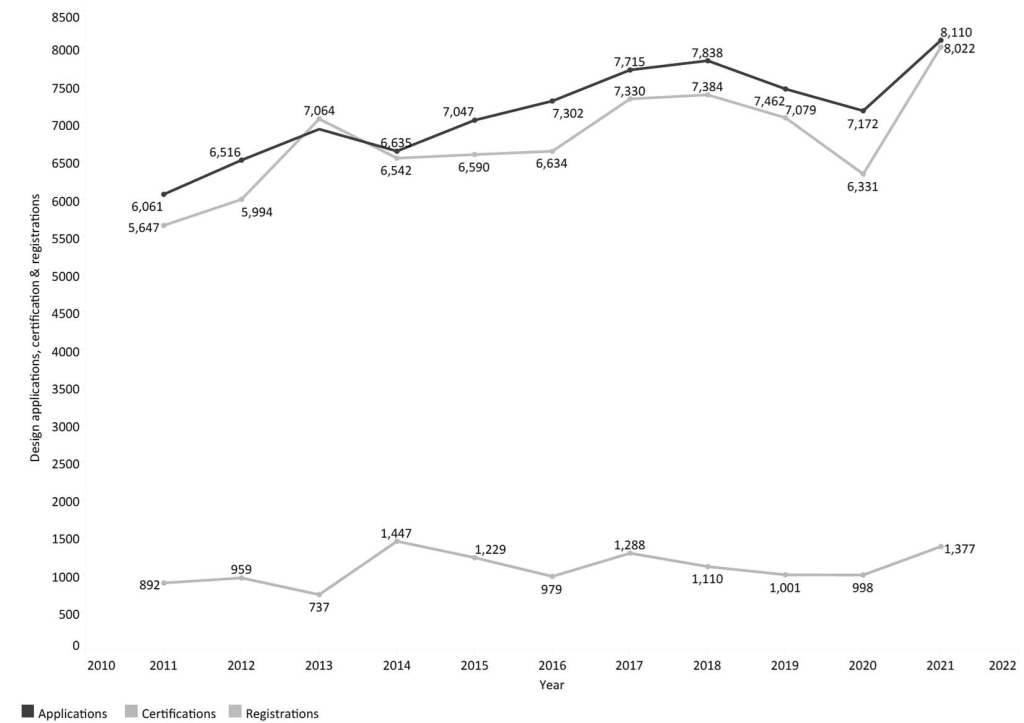
Figure 3 shows that over 8100 design applications were filed in 2021, which is a 13% increase over the previous year. This growth can be entirely attributed to non-resident applications, which accounted for 68% of the total applications in 2021. Over 1370 designs were certified in 2021, representing a 38% growth from the previous year.
Countries of origin
The leading countries of origin were the United States, China, the United Kingdom, Germany and Japan in 2021. Notably, designs applications from China grew by 61% in 2021.
Design classes
The five classes in the Locarno Classification system that received the most applications in 2021 were:
- means of transport or hoisting
- recording, telecommunication or data processing equipment
- medical and laboratory equipment
- packaging and containers
- furnishing
Leading applicants
The top five international applicants were Koninklijke Philips, Beijing Xiaomi Mobile Software, Apple, Aussie Union Group Hongkong and Fisher & Paykel Healthcare, while the top five domestic applicants were Zimmermann Wear, Phoenix Industries, Vuly Property, Frankie4 IP 1 and With Jéan.
Overseas applications
A total of 2225 overseas design applications were filed by Australian applicants in 2020. The most popular destination for Australian design innovators is the United States, followed by the European Union Intellectual Property Office, New Zealand and China.
Plant breeder’s rights
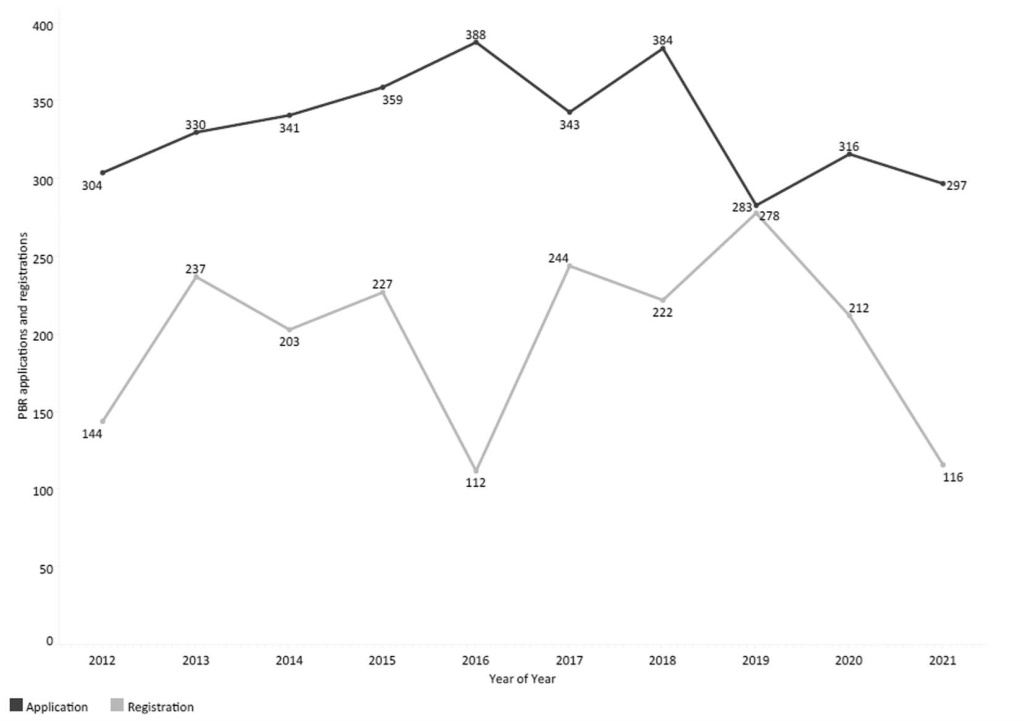
In 2021, 297 PBR application were filed, which accounted for a 6% decrease from 2020. Despite a 9% decline, non-residents held a higher share of PBR applications (58%) in 2021 when compared to residents (42%). The Netherlands and the United States retained their status as the two major foreign countries of origin for PBR filings in Australia.
Copyright
The Report confirms the extensive level at which copyright material is used. For example, in 2021, over 409,000 copyright owners in the music industry received a total of $430.7 million. Further, $102 million in revenue was distributed to more than 17,000 rights holders including writers, artists, publishers and agents by Copyright Agency Ltd (CAL). $36.4 million was distributed to registered artists and licensors by the Phonographic Performance Company of Australia (PPCA), and $45.3 million was distributed to 4900 copyright owners in the audiovisual sector such as producers, directors, broadcasters and agents by Screenrights.
Enterprise growth
The Report noted that small businesses contribute disproportionately to job creation and aggregate productivity growth (by one estimate, up to 60% of growth) through their innovative activity. Also, after filing for IP rights, Australian SMEs are more likely to achieve high growth than their peers (ie, one study that was cited estimates a 22% increase in firm size following the grant of a patent), and pay a higher median annual wage.
The data presented in the Report suggest that “IP activity is a significant forward indicator of employment growth for Australian SMEs”, and that the results are:
…consistent with previous “event studies” showing that significant increases in size, skill and capital intensity within a firm coincide with the grant of a patent, though a business may take up to 3 years to scale to its new level. [10]
Research program
Apart from the statistics, the report also details IP Australia’s research programs. The three main programs include: the Office of the Chief Economist (OCE), the Centre of Data Excellence (CODE) and the Patent Analytics Hub (Hub). These programs accomplish many things, for example: the OCE investigates the impact of IP policies and activities on Australian businesses and economy; the CODE analyses, presents and reports data across all IP rights; and the Hub assists Australian innovators by extracting value from patent databases in order to make the most of their IP by aiding understanding of their technology areas, finding collaborators and boosting the commercial returns from research.
The Report, and these programs, are well worth a more detailed review for interested parties.
This article was first published in the Intellectual Property Law Bulletin 35.5, August 2022.
[1] IP Australia Australian Intellectual Property Report 2022 (April 2022) www.ipaustralia.gov.au/files/ip-report-2022.
[2] Above, p 2.
[3] Reproduced with permission from IP Australia. See above n 1, p 5.
[4] Above n 1, p 17.
[5] Above.
[6] Above n 1, p 20.
[7] Reproduced with permission from IP Australia. See above n 1, p 19.
[8] Reproduced with permission from IP Australia. See above n 1, p 25.
[9] Reproduced with permission from IP Australia. See above n 1, p 31.
[10] Above n 1, p 46.